The Intelligence Industrielle website gets a makeover

OEE Solution

The turnkey solution that maximizes your Overall Equipment Effectiveness, eliminates downtime, and elevates your efficiency to the next level, without overburdening your operators.

Intelligence Industrielle dashboard showing the status of a CNC milling machine with indicators such as runtime, overall efficiency rate, pace, performance, and quality of produced pieces.
Intelligence Industrielle production monitoring interface indicating a detected stoppage. Three causes of stoppage are listed: tool shortage, material shortage, and clamp problem. Each cause is represented by a corresponding icon.
Intelligence Industrielle's rule engine showing a conditional flow. When a button is pressed, an action is triggered to send an SMS to Martin. An option to add an additional condition and select another action is also visible.

Connect your machines

Collect data from any machine.

Capture the downtimes

The operator enters the causes of downtime on their tablet.

Analyze the data in depth

Analyze with dashboards and reports.

Optimize the processes

Eliminate bottlenecks causing downtime.

The Challenge

Without data visibility, manufacturers operate blindly. Unplanned downtime, hidden inefficiencies, and poorly informed decisions slow down production. This lack of control can impact customer satisfaction.

The Solution

Tracking the OEE of your machines is essential for optimizing production. With real-time monitoring and analytical reports, Intelligence Industrielle OEE solution allows you to identify downtime causes and take action based on reliable data.

Discover how OEE is transforming your production

Machine Connectivity

Intelligence Industrielle connects your machines and integrates with your ERP/MES systems seamlessly, requiring no intervention on your part.

Downtime Tracking Tablet

Your operators have a simple interface to justify downtime—reducing their effort and enhancing supervisors' responsiveness.

Live Dashboard

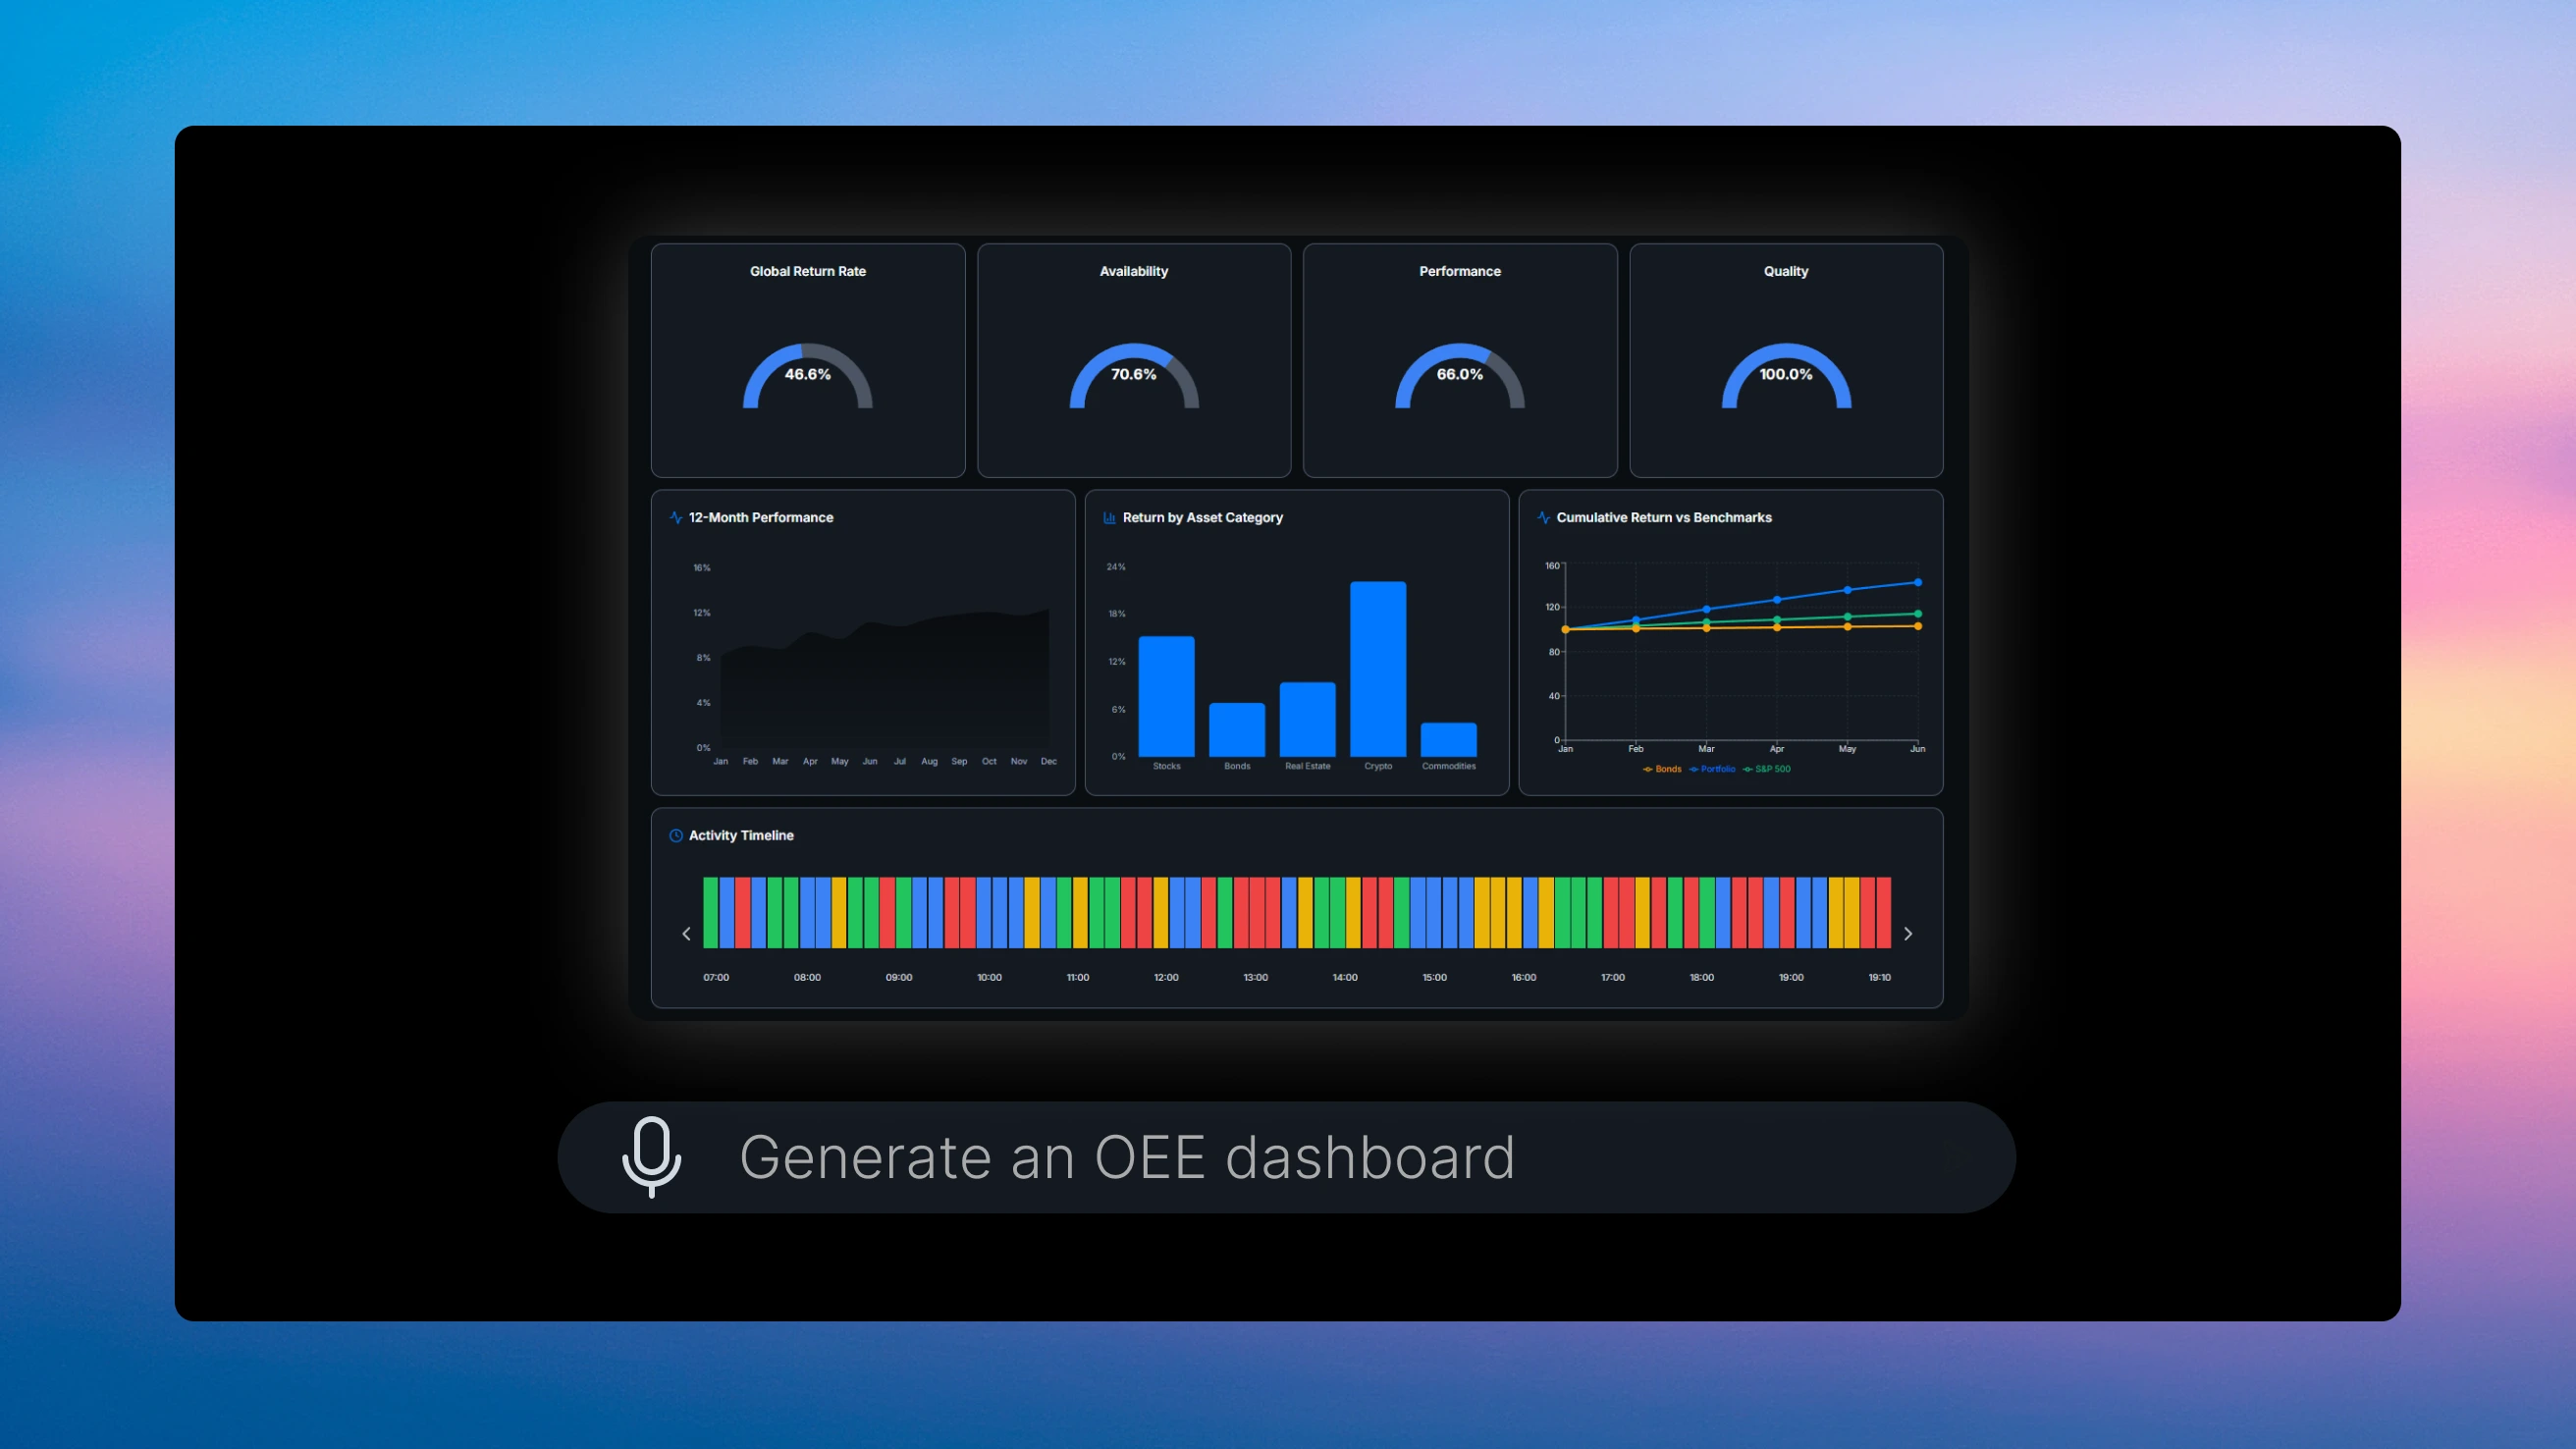
Instantly visualize key metrics like availability, performance, and more. Dashboards provide a clear, precise overview of your production, along with comprehensive tracking of all essential parameters.

Historical Reports

View your performance from every angle and benefit from seamless integration with Power BI to optimize your processes. Use this information to enhance your operations, calculate the ROI of your improvement projects, and even attract investors.

Empower

Providing tracking tools motivates your teams by allowing them to see the impact of their work.

Reduce Downtime

Optimize productivity and reduce costs by minimizing recurring production interruptions.

Profitability

Saving just one minute of downtime each day on a single machine is enough to make our solution profitable.

Rapid turnkey delivery in 5 weeks

1
Exploratory Meeting

Complete diagnosis and product demonstration to identify improvements.

2
Project Launch

Our project managers collect information to adapt the solution to your reality.

3
Connecting Your Machines

Our installers ensure the study and connectivity of your equipment (even the oldest).

4
Interface Configuration

We configure intuitive interfaces tailored to your operations.

5
Delivery and Training

We deliver the solution and train your teams for complete autonomy.

Included with the OEE Solution

Cross-Platform

Access your data and reports from any device, whether in the field or at the office.

Dedicated Support

Dedicated account manager for seamless change management and to meet your needs.

Updates

New features without service interruption, with continuous updates to stay at the cutting edge.

Training Included

We train your teams for quick and efficient adoption, with no additional fees.

Open API

Seamlessly integrates with your existing systems. Centralize your data effortlessly.

Assisted Migration

We assist you with data migration and the setup of your new system.

Connect your shop floor as early as next month

Book a demo to see how Intelligence Industrielle can adapt to your factory.

View and customize as you like

Customizing your dashboards has never been easier. Organize, modify, and adjust your metrics freely for a tailored experience that meets your needs. Because your production is unique, your interface should be too.

The Powerful Rules Engine

Automate actions based on your data, without any coding. Configure and optimize each step for complete control, while customizing the solution independently, with no need for developers.

Alert supervisors immediately

Alert the right person, at the right time, via SMS, email, or notification to reduce response times, minimize interruptions, and quickly get production back on track.

Performance Indicators

Visual indicators transform complex data into powerful, real-time insights, enabling every team member to make quick operational decisions.

Production History

Access detailed history of each production batch, including associated indicators, production events, and adjustments made.

Bar chart showing the main causes of stoppages in the Intelligence Industrielle interface. The three categories represented are material shortage, machine breakdowns, and setup, with bars of varying heights indicating the relative significance of each cause.

Monitor from anywhere

Whether you're in the office or on the go, access your dashboards and historical reports to keep an eye on your performance.

Intelligence Industrielle dashboard displaying availability at 66.7% and quality at 100% on circular charts. The indicators are placed over a map to show that they can be tracked from anywhere, with a bar chart below illustrating the progression of completed pieces.
Circular chart displaying the overall efficiency rate at 55.1% in the Intelligence Industrielle interface. The chart shows a partial performance progression between 0% and 100%.Bar chart showing the main causes of stoppages in the Intelligence Industrielle interface. The three categories represented are material shortage, machine breakdowns, and setup, with bars of varying heights indicating the relative significance of each cause.Intelligence Industrielle dashboard displaying availability at 66.7% and quality at 100% on circular charts. The indicators are placed over a map to show that they can be tracked from anywhere, with a bar chart below illustrating the progression of completed pieces.

Connect your shop floor as early as next month

Book a demo to see how Intelligence Industrielle can adapt to your factory.